社群報告 · 2026 年 8 月 26 日
同一套玩具,不同城市的收藏地圖
上一篇報告整理了全國比例。隨著更多收藏者加入,這次我們進一步看看:不同城市看到的玩具組合是否不太一樣。
Happy Toy Scout 上線不到四天半,已累積來自 45 州、2,058 家麥當勞門市的 8,935 筆社群回報,其中 393 筆為售罄回報。
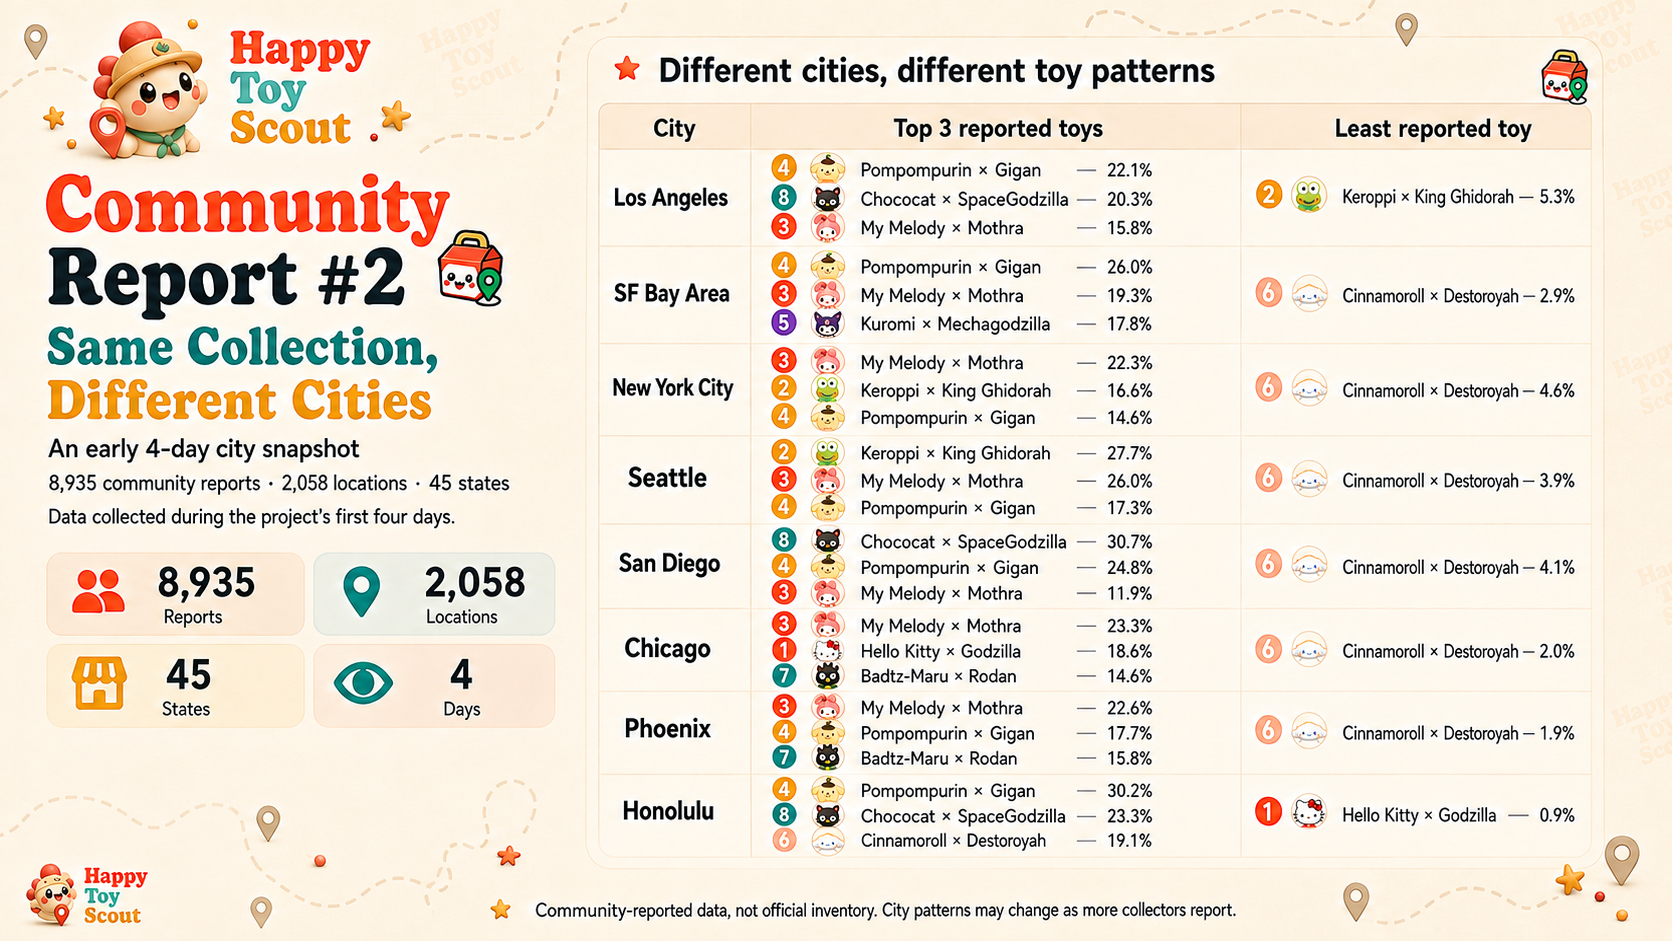
全國平均可能不是完整的故事
目前全國 #4 Pompompurin × Gigan 佔 20.9%,其次是 #3 My Melody × Mothra 的 19.1%、#8 Chococat × SpaceGodzilla 的 15.9%,以及 #7 Badtz-Maru × Rodan 的 11.5%。但城市結果並不完全相同。
不同城市目前回報了什麼?
| 城市 | 最多回報的玩具 | 最少回報 |
|---|---|---|
| Los Angeles |
| #2 Keroppi × King Ghidorah — 5.3% |
| SF Bay Area |
| #6 Cinnamoroll × Destoroyah — 2.9% |
| New York City |
| #6 Cinnamoroll × Destoroyah — 4.6% |
| Seattle |
| #6 Cinnamoroll × Destoroyah — 3.9% |
| San Diego |
| #6 Cinnamoroll × Destoroyah — 4.1% |
| Chicago |
| #6 Cinnamoroll × Destoroyah — 2.0% |
| Phoenix |
| #6 Cinnamoroll × Destoroyah — 1.9% |
| Honolulu |
| #1 Hello Kitty × Godzilla — 0.9% |
幾個值得持續觀察的早期訊號
- San Diego 的 #8 Chococat × SpaceGodzilla 佔 30.7%。
- Seattle 的 #2 Keroppi × King Ghidorah 佔 27.7%。
- Honolulu 的 #4 Pompompurin × Gigan 佔 30.2%。
- SF Bay Area 的 #4 Pompompurin × Gigan 佔 26.0%。
- Chicago 的 #1 Hello Kitty × Godzilla 約佔 18.6%,高於目前全國比例。
城市差異可能代表什麼?
這些早期差異不足以證明官方配貨比例不同,可能受到補貨批次、門市消耗速度、收藏者偏好,以及回報地點和時間影響。我們把它們視為社群呈現的早期訊號,不是官方供應或稀有度。
售罄回報也呈現城市差異
在回報量較充足的城市中,回報標記為售罄的比例約為:Phoenix 8.2%、Los Angeles 6.1%、Seattle 5.1%、Chicago 4.8%、San Diego 4.7%、New York City 4.1%、Honolulu 3.6%、SF Bay Area 3.3%。這些是社群回報中的比例,不是官方庫存比例。
我們目前學到的事情
- 全國平均可能掩蓋有意義的城市差異。
- 同一套玩具在不同地區可能呈現不同的回報組合。
- 社群資料不只用來找玩具,也能觀察收藏活動如何發展。
- 更大且更平均的資料量,才能看出這些模式是否持續。
重要提醒
這是活動開始前四天的早期快照。各城市回報量並不平均,趨勢也可能隨著更多收藏者加入而改變。回報不是官方庫存,不能保證有貨。