Community report · August 26, 2026
The same toy collection, different city patterns
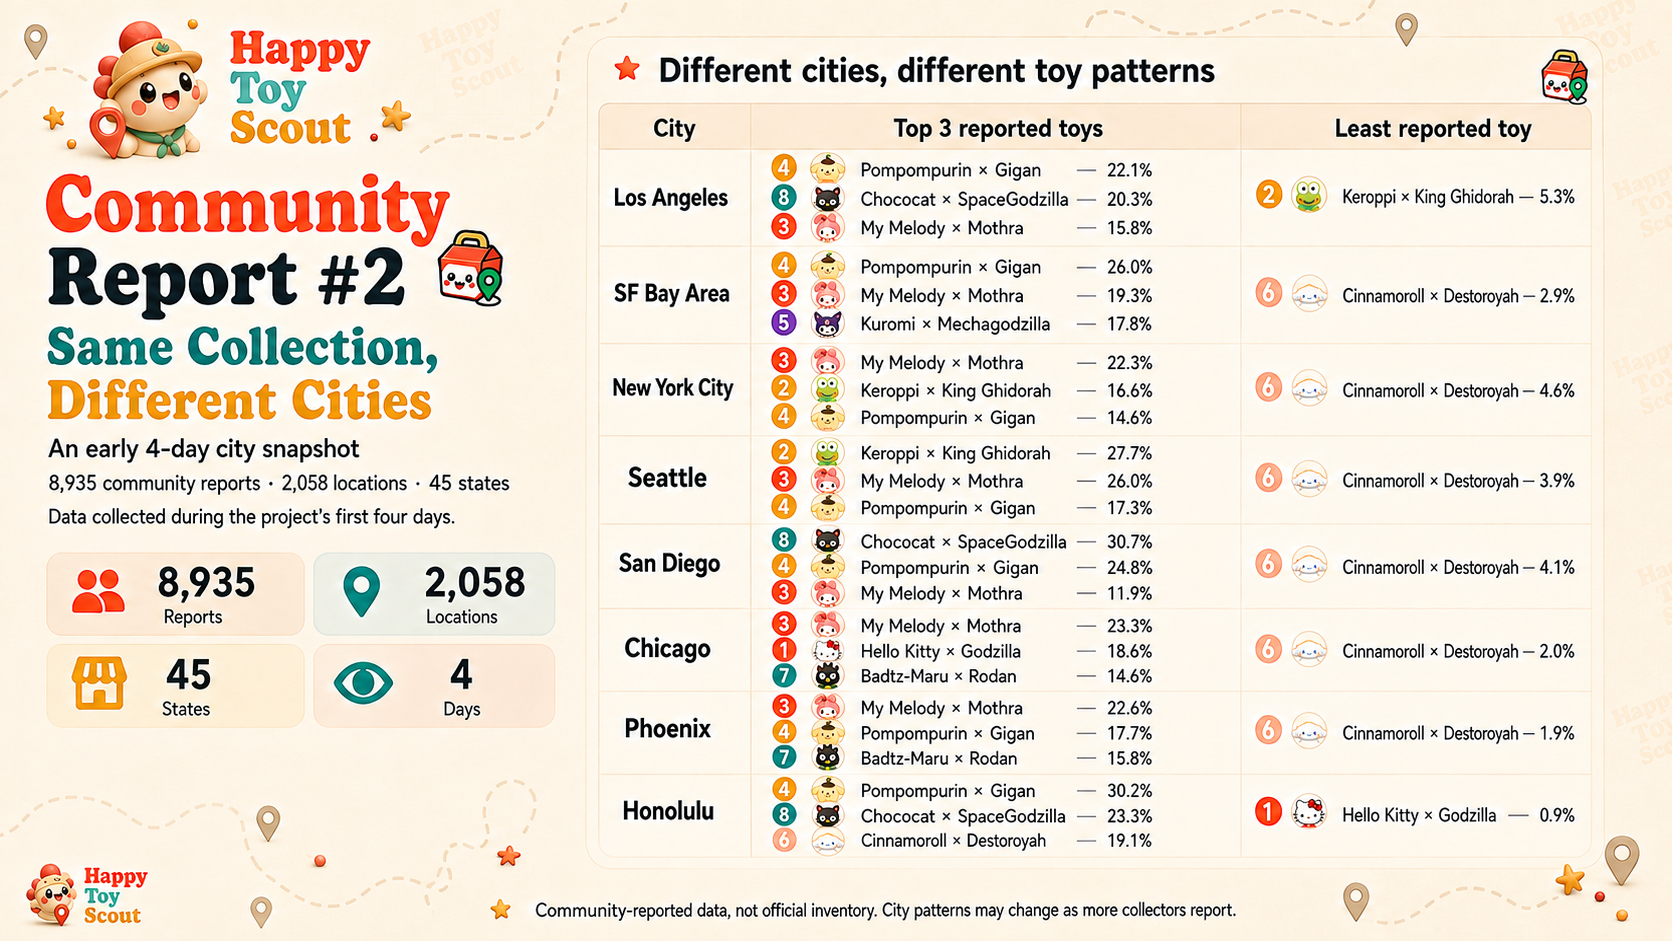
Our first report looked at the national mix. With more collectors contributing, this update asks whether the toys people report differ from city to city.
In fewer than four and a half days, Happy Toy Scout has collected 8,935 community reports from 2,058 McDonald’s locations across 45 states, including 393 sold-out reports.
The national average is only part of the story
Nationally, #4 Pompompurin × Gigan appears in 20.9% of reports, followed by #3 My Melody × Mothra at 19.1%, #8 Chococat × SpaceGodzilla at 15.9%, and #7 Badtz-Maru × Rodan at 11.5%. City-level results are not identical.
What are collectors reporting in each city?
| City | Most reported toys | Least reported |
|---|---|---|
| Los Angeles |
| #2 Keroppi × King Ghidorah — 5.3% |
| SF Bay Area |
| #6 Cinnamoroll × Destoroyah — 2.9% |
| New York City |
| #6 Cinnamoroll × Destoroyah — 4.6% |
| Seattle |
| #6 Cinnamoroll × Destoroyah — 3.9% |
| San Diego |
| #6 Cinnamoroll × Destoroyah — 4.1% |
| Chicago |
| #6 Cinnamoroll × Destoroyah — 2.0% |
| Phoenix |
| #6 Cinnamoroll × Destoroyah — 1.9% |
| Honolulu |
| #1 Hello Kitty × Godzilla — 0.9% |
Early signals worth watching
- San Diego shows #8 Chococat × SpaceGodzilla in 30.7% of reports.
- Seattle shows #2 Keroppi × King Ghidorah in 27.7%.
- Honolulu shows #4 Pompompurin × Gigan in 30.2%.
- SF Bay Area shows #4 Pompompurin × Gigan in 26.0%.
- Chicago shows #1 Hello Kitty × Godzilla at about 18.6%, above the current national share.
What might city differences mean?
These early differences do not prove different official distribution. They may reflect restocking waves, how quickly stores sell through toys, collector preferences, or where and when people are reporting. We treat them as community signals, not official supply or rarity.
Sold-out reports also vary by city
Among cities with enough reports, the share marked sold out is approximately Phoenix 8.2%, Los Angeles 6.1%, Seattle 5.1%, Chicago 4.8%, San Diego 4.7%, New York City 4.1%, Honolulu 3.6%, and SF Bay Area 3.3%. These are shares of community reports, not official inventory rates.
What we are learning
- The national average can hide meaningful local differences.
- The same collection can look different across regions.
- Community data can show how a collection develops, not only where to look today.
- A larger, more balanced set of reports will tell us whether these patterns last.
Important note
This is an early snapshot from the first four days of the collection. Reporting volume is uneven, and city patterns may change as more collectors contribute. Reports are not official inventory and cannot guarantee availability.